


The Overview Report gives you a live snapshot of your support operation as it is happening. It shows conversation queue health, agent availability, traffic patterns, and individual agent workload — all updating in real time without needing to refresh the page.
To access it, go to Reports → Overview.
What the Overview Report Shows
The report is divided into four sections, each covering a different dimension of your current support activity:
| Section | What it monitors |
| Open Conversations | Current queue state — open, unattended, unassigned, and pending counts |
| Agent Status | Real-time availability of every team member |
| Conversation Traffic | A 7-day heatmap of when conversations arrive by hour |
| Conversations by Agents | How many active conversations each agent is currently managing |
All sections are marked Live and update continuously.
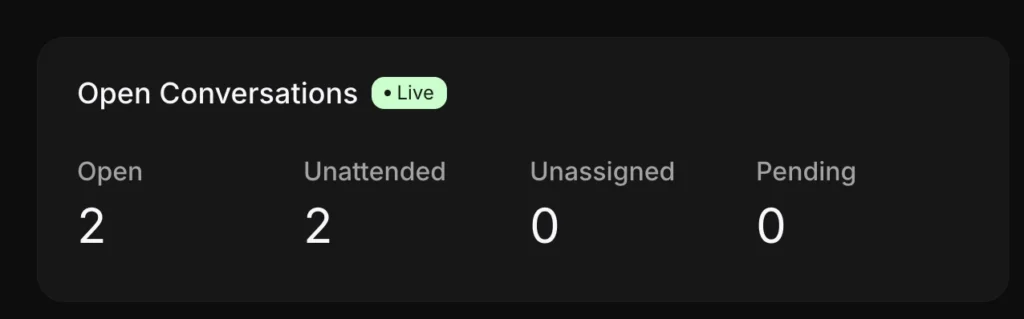
Open Conversations
The Open Conversations panel shows the current state of your conversation queue, broken into four counts:
| Status | What it means |
| Open | Active customer interactions currently in progress |
| Unattended | Conversations that have not yet received any reply from an agent |
| Unassigned | Conversations not yet allocated to a specific agent |
| Pending | Conversations marked as waiting — typically awaiting a customer reply or external action |
Use the All Teams dropdown to filter the queue view by a specific team.
How to use it: The Unattended count is your most actionable real-time signal. A rising Unattended number during active hours means conversations are arriving faster than your team is claiming them. Combine this with the Agent Status panel to determine whether more agents need to come online or whether unassigned conversations need to be distributed.
Agent Status
The Agent Status panel shows the real-time availability of every agent in your workspace:
| Status | What it means |
| Online | Agent is available and can take new conversations |
| Busy | Agent is actively handling conversations and is not available for new ones |
| Offline | Agent is not logged in or has marked themselves unavailable |
How to use it: During peak hours, compare Online agent count against your Open and Unattended counts. If Unattended is high and most agents are Busy, you may need to redistribute load or bring additional agents online. If agents are Online but Unattended is still high, conversations may not be getting claimed — check your assignment rules.
Conversation Traffic
The Conversation Traffic heatmap shows when conversations arrive across the last 7 days, broken down by hour. Each cell in the grid represents one hour of one day. The darker the cell, the higher the conversation volume during that period. Hovering over any cell reveals the exact count for that hour.
Use the Download report button in the top-right of the heatmap to export the traffic data.
How to read the heatmap:
- Darker columns or cells signal peak hours — times when your queue receives the highest volume
- Lighter cells signal low-traffic periods
- Consistent dark patterns across multiple days confirm predictable peak windows, not one-off spikes
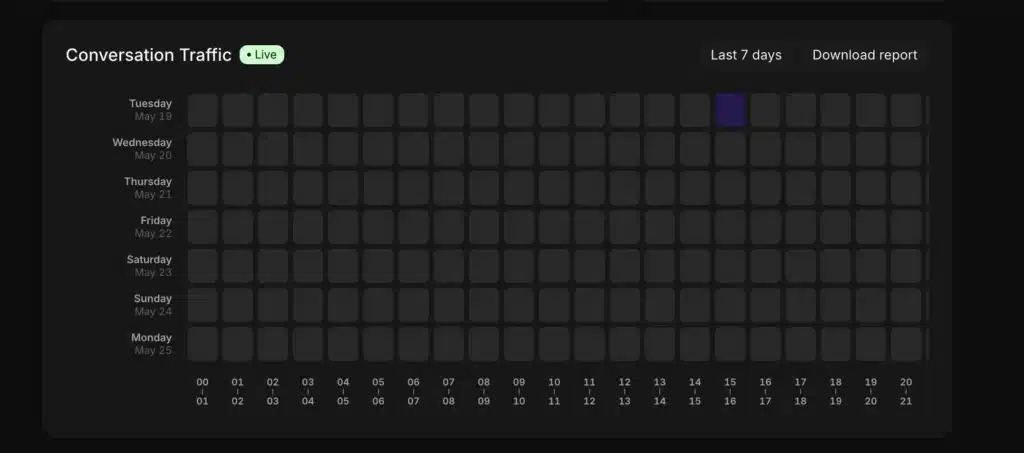
How to use it: Use the heatmap to align staffing with actual demand. If conversations consistently spike between 10am and 2pm on weekdays, that is when you need maximum agent availability. If Saturday afternoons show persistent dark cells but weekend staffing is light, that is a coverage gap worth addressing.
Conversations by Agents
The Conversations by Agents section shows how many active conversations each agent is currently managing. Use it to:
- Assess real-time workload distribution across the team
- Identify agents who may be overloaded while others have capacity
- Monitor whether conversations are being claimed and worked, or sitting idle
How to use it: If one agent shows significantly more active conversations than others, consider manually redistributing or adjusting your automation rules to balance load. This section is most useful during high-volume periods when manual oversight of the queue is needed.
Other Reports Available
The Overview Report is one of several report types in Inquirly. The full Reports menu includes:
- Conversations — historical conversation volume and resolution metrics
- Agents — per-agent performance over time
- Labels — breakdown of conversations by label
- Inbox — performance by channel
- Team — performance by team group
- CSAT — customer satisfaction survey results
- SLA — SLA compliance tracking
- Aily — AI assistant performance metrics
Campaign — campaign conversation data