A practical benchmark guide for SaaS and customer support teams measuring AI resolution, self-service, satisfaction, escalation, speed, and cost; without confusing activity with successful outcomes.
Customer support benchmarks help teams understand whether their support operation is actually improving; not simply whether agents are answering more tickets.
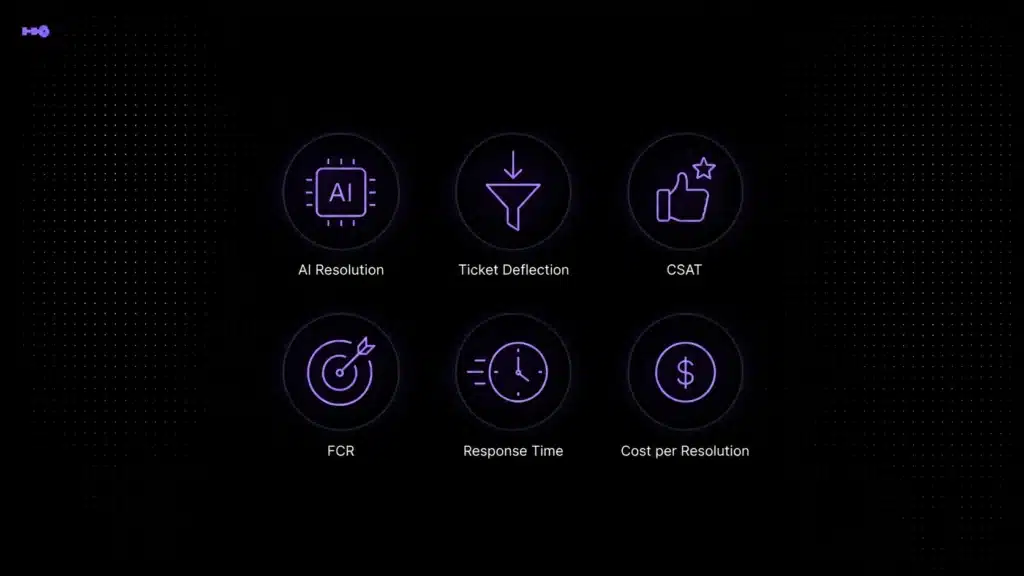
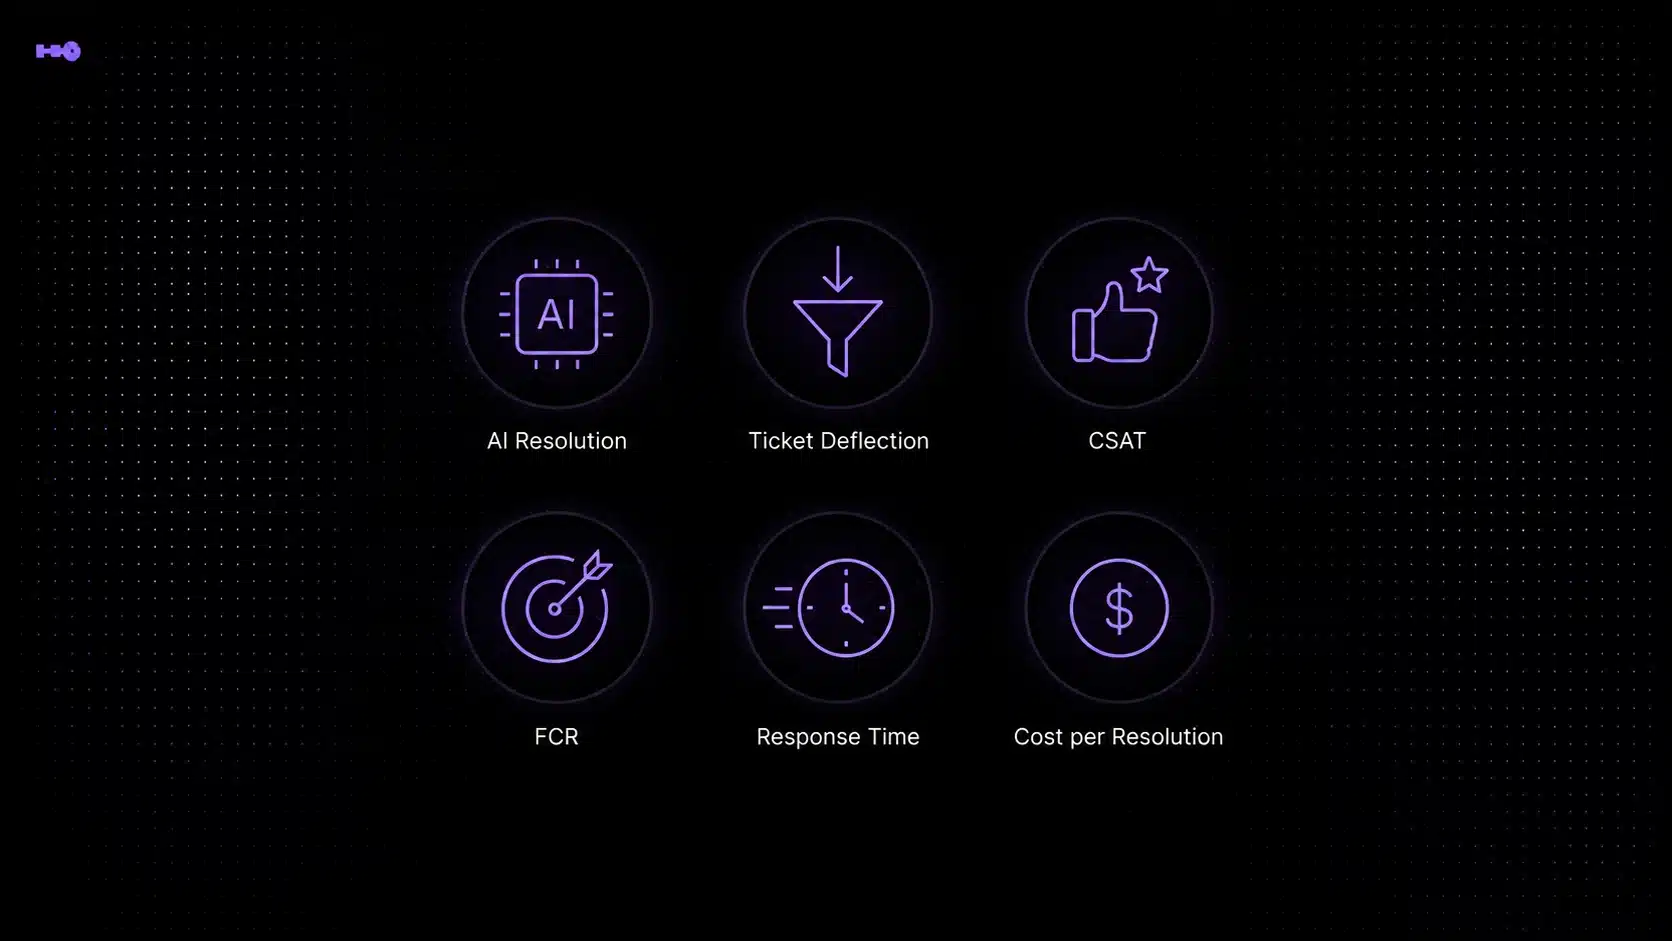
In 2026, the benchmark set has expanded. Traditional metrics such as CSAT, first response time, first contact resolution, and cost per resolution still matter, but AI-powered support introduces additional measures such as AI resolution rate, ticket deflection rate, automation rate, and escalation rate.
There is no single number that defines “good customer support.” Benchmarks vary by channel, industry, issue complexity, customer segment, and how each platform defines a resolution. A SaaS company handling technical API questions should not expect the same automation rate as an ecommerce company answering repetitive shipping questions.
The best approach is to use external benchmarks for context, then compare performance against your own baseline, eligible support volume, and quality standards.
Customer Support Benchmarks for 2026: Quick Answer
Zendesk says a “good” CSAT score typically falls between the mid-70s and mid-80s, while Salesforce describes 70–75% as a common FCR goal for contact centers.
For AI resolution, published figures require more caution. Intercom currently reports that Fin averages a 76% resolution rate across 12,000+ customers. This is a vendor-specific data point; not a universal benchmark for every AI support system or support team.
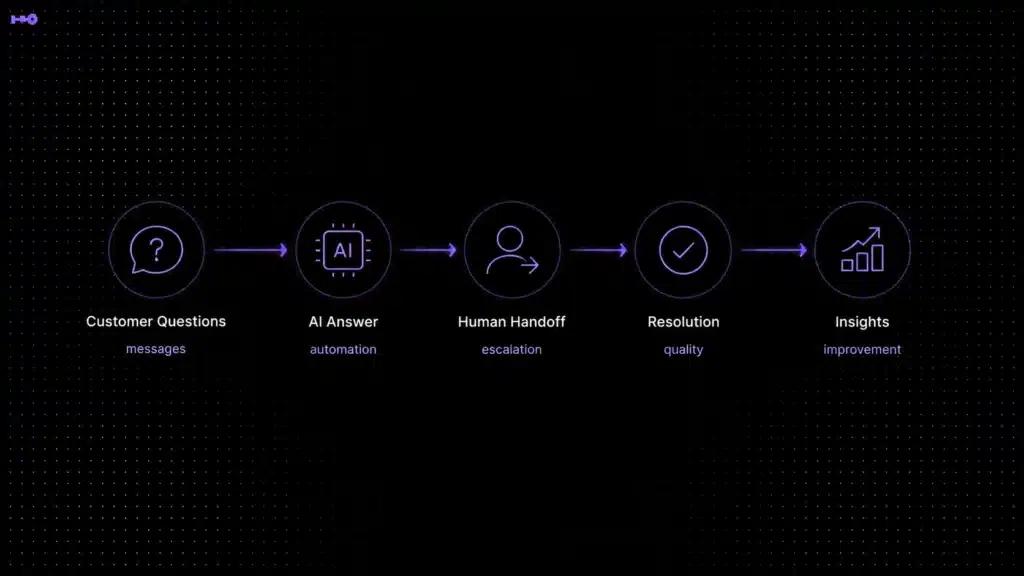
Why Customer Support Benchmarks Matter More in 2026
Customer expectations are changing quickly. Zendesk’s 2026 CX Trends research reports that 74% of consumers expect customer service to be available 24/7, while 88% expect faster response times than they did one year earlier.
AI adoption is also moving from experimentation into normal support operations. Salesforce reports that adoption of AI agents in customer service organizations rose from 39% in 2025 to 66% in 2026. Its State of Service research also says service organizations expect AI to handle 50% of customer service cases by 2027, up from 30% in 2025.
But adoption does not automatically equal maturity. Intercom’s 2026 Customer Service Transformation Report says 82% of senior leaders invested in AI for customer service during the previous 12 months and 87% planned further investment in 2026, while only 10% described their deployment as mature and fully integrated.
1. AI Customer Support Resolution Rate
What is AI resolution rate?
AI resolution rate measures the percentage of eligible AI-handled conversations that are successfully resolved without unnecessary human intervention.
Example: 1,000 conversations are eligible for AI, AI handles 800, and 520 are successfully resolved without unnecessary escalation or reopening. The AI resolution rate is 65%.
What is a good AI resolution rate?
There is no reliable universal benchmark yet. Intercom’s 76% average for Fin is useful as a vendor-specific reference point, but knowledge quality, customer mix, automation rules, supported actions, and eligible issue types differ between deployments.
For your own team, compare this month’s successful AI resolution rate with the previous period for the same support intents.
A 55% overall resolution rate could be excellent if AI is handling difficult technical requests. It could be poor if the system is only answering basic FAQs.
2. Ticket Deflection Rate
What is ticket deflection rate?
Ticket deflection rate measures how often customers successfully find an answer through self-service or automation without creating a human support ticket.
Deflection can happen through AI chat, help-center search, knowledge base articles, automated workflows, in-product guidance, FAQs, or community content.
The word successful matters. If 1,000 people use your chatbot and 400 leave without opening a ticket, you cannot automatically claim 40% deflection. Some may have solved the problem; others may simply have abandoned the interaction.
What is a good ticket deflection rate?
There is no universal ticket deflection rate that every company should target. Deflection depends on the percentage of repetitive questions, knowledge quality, product complexity, channel, customer type, AI accuracy, escalation rules, and the measurement definition.
Ticket deflection rate vs. AI resolution rate
AI resolution rate asks: Of the conversations AI handled, how many did AI successfully resolve?
Ticket deflection rate asks: How many potential human support contacts were prevented because customers solved the problem before creating a ticket?
3. Customer Support Automation Rate
Customer support automation rate measures the proportion of eligible support demand completed without direct manual handling by a human agent.
Suppose a team receives 10,000 conversations each month, but only 6,000 are considered safe and appropriate for automation. If AI successfully resolves 3,600 of those conversations, that is 60% automation of eligible demand and 36% of total support demand.
Is a higher automation rate always better?
No. An 80% automation rate that generates incorrect answers, repeat contacts, cancellations, or frustrated customers can be worse than a 50% automation rate with strong accuracy and clean escalation.
- CSAT
- Reopen or repeat-contact rate
- Escalation quality
- Resolution accuracy
- Customer effort
4. AI Escalation Rate
AI escalation rate measures how often an automated support interaction is transferred to a human agent.
Correct escalation
AI identifies that the issue needs human judgment and transfers it appropriately; for example, account security, refund exceptions, sensitive billing disputes, legal questions, or serious product failures.
Avoidable escalation
The knowledge or workflow existed, but AI failed to solve the issue. These are improvement opportunities.
Missed escalation
AI should have transferred the customer but continued trying to answer. This is usually the highest-risk category.
Chatbot to Human Handoff: Best Practices, Triggers and Workfow Examples →
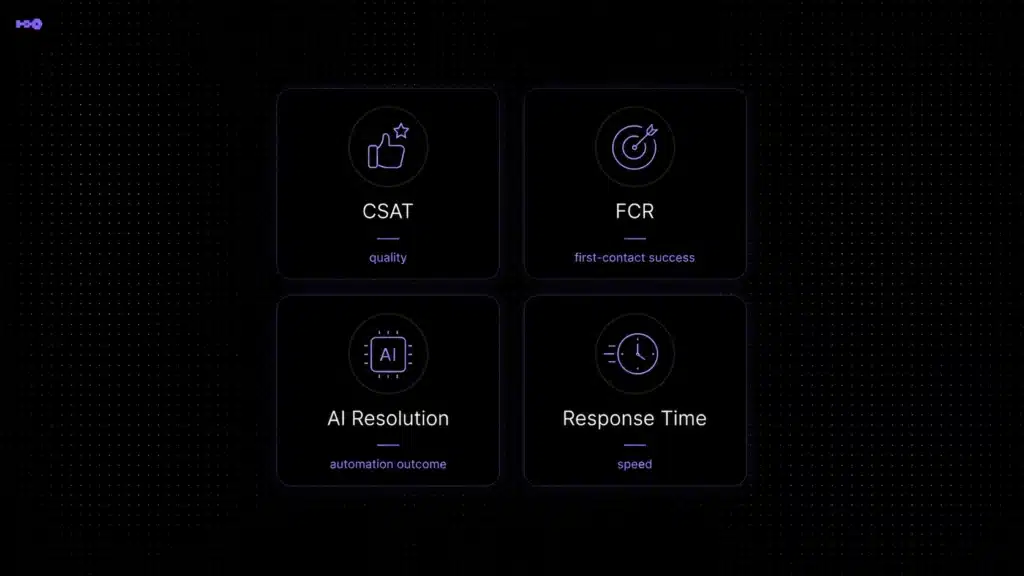
5. Customer Satisfaction Score (CSAT)
CSAT measures how satisfied customers are with a specific interaction.
If 425 out of 500 respondents choose a positive satisfaction rating, CSAT is 85%.
AI support CSAT should be measured separately
- AI-resolved CSAT
- Human-agent CSAT
- AI-to-human handoff CSAT
- CSAT by support intent
- CSAT by channel
6. First Contact Resolution (FCR)
First Contact Resolution measures how often a customer’s problem is completely solved during the first interaction.
Salesforce describes an FCR rate between 70% and 75% as a common contact-center benchmark, while noting that targets vary.
7. First Response Time
First response time measures how long a customer waits before receiving the first meaningful response.
An automated “We received your request” message is technically a response, but it is not necessarily useful support. Benchmark response time separately for live chat, email, in-app messaging, urgent tickets, standard tickets, and SLA customers.
For a deeper guide to measurement, queue ownership, routing, SLA visibility, and practical ways to reduce delays, see our guide to improving first response time.
8. Resolution Time
Resolution time measures how long it takes from the start of a support request until the customer’s actual problem is solved.
Track both median resolution time and the 90th percentile. Averages can hide bad experiences: nine tickets resolved quickly and one ticket left open for days may still produce an average that looks acceptable.
9. Cost per Resolution
Cost per resolution shows what your support operation spends to successfully solve one customer issue.
Include relevant costs such as support salaries and employer costs, support software, AI usage, outsourcing, management time, implementation, and administration.