A practical guide for SaaS support teams that want better measurement than satisfaction scores alone.
Support metrics are the measures a team uses to understand support quality, efficiency, and customer outcomes. Beyond CSAT and NPS, stronger scorecards often include customer effort score, experience-level signals, and outcome-quality metrics that show whether support actually made the customer’s job easier.
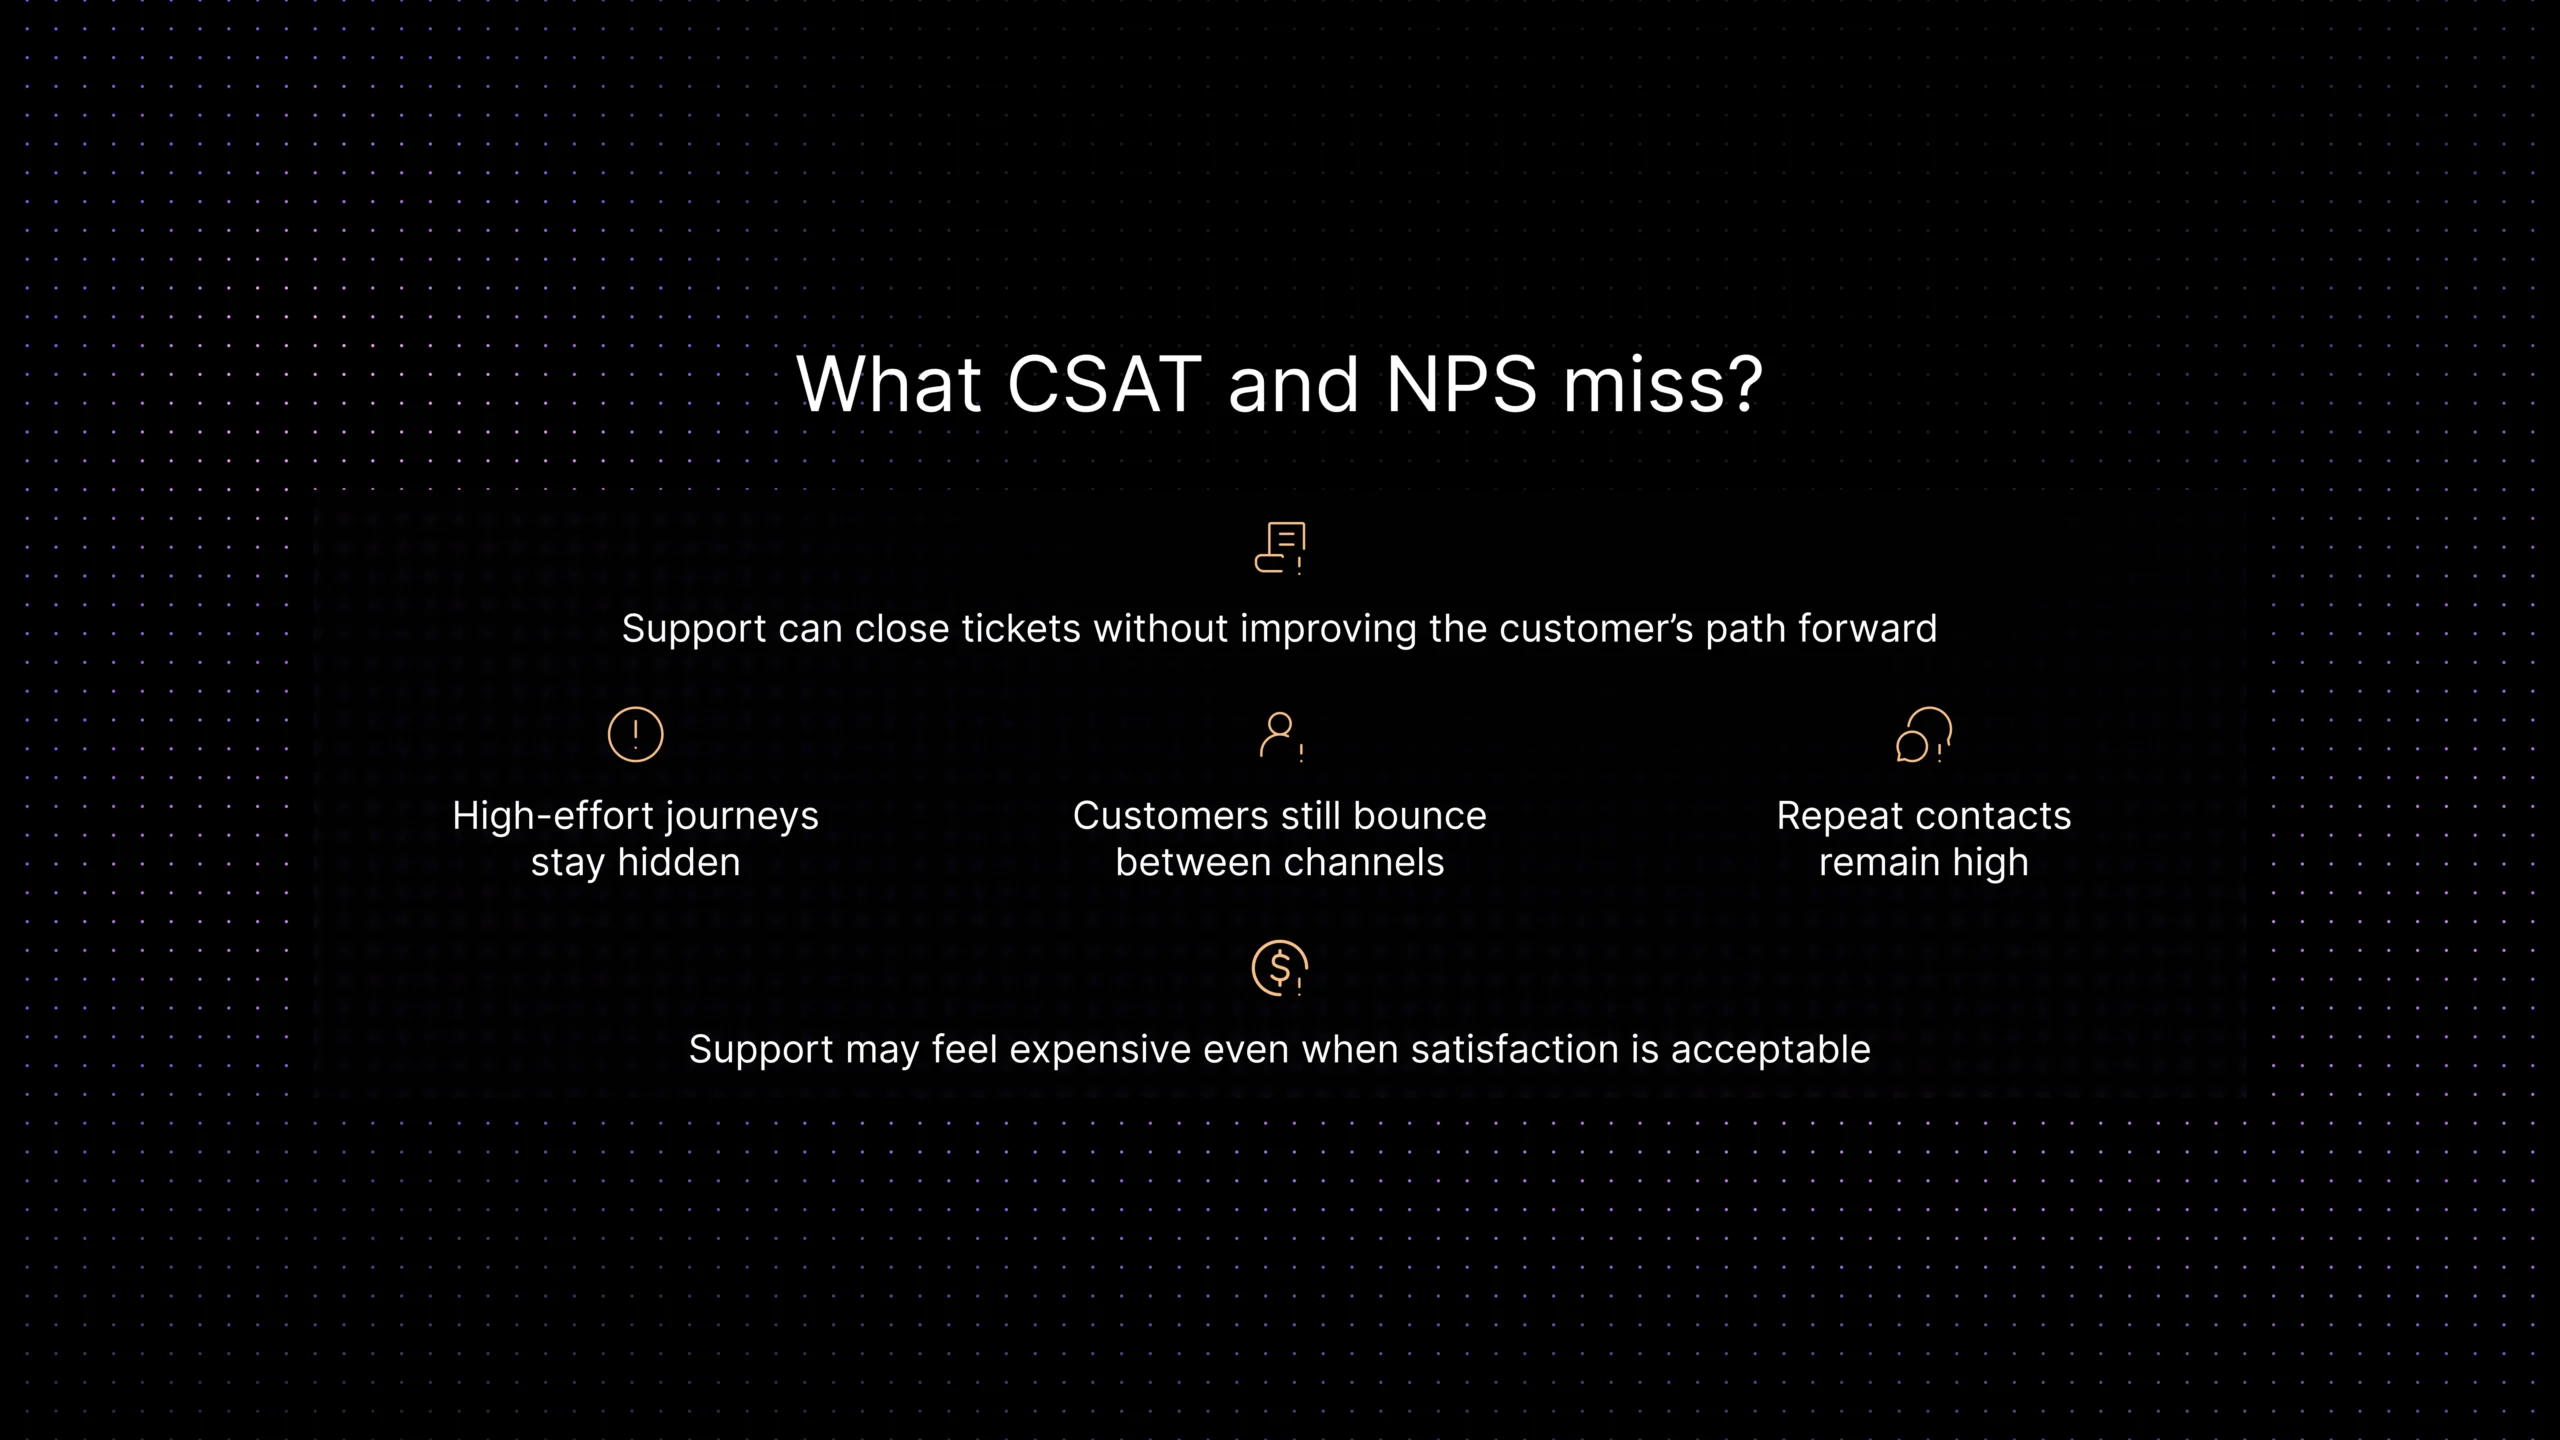
Most support teams do not start with a metrics problem. They start with a visibility problem. CSAT looks acceptable. NPS is not alarming. The dashboard says the team is doing fine. But customers still bounce between channels, repeat contacts remain high, the same issue shows up twice in one week, and leaders cannot clearly explain whether support is actually getting easier, faster, or more effective.
That gap matters more in SaaS than it does in a lot of other categories. Support is not only answering questions. It is helping customers adopt features, recover from friction, unblock workflows, renew confidence after an issue, and decide whether the product still feels worth the effort. A satisfaction score can tell you whether someone liked a moment. It cannot always tell you whether support reduced effort, improved the outcome, or prevented more work later.
That is where support metrics beyond CSAT and NPS become useful. This article explains which metrics matter once simple sentiment scores stop being enough, how customer effort score and experience-level signals fit into a smarter scorecard, and how to measure outcome quality without turning support reporting into a giant analytics project. The goal is not more numbers. It is better visibility into whether support actually made the customer’s job easier, more accurate, and easier to trust.
What support metrics should measure in practice
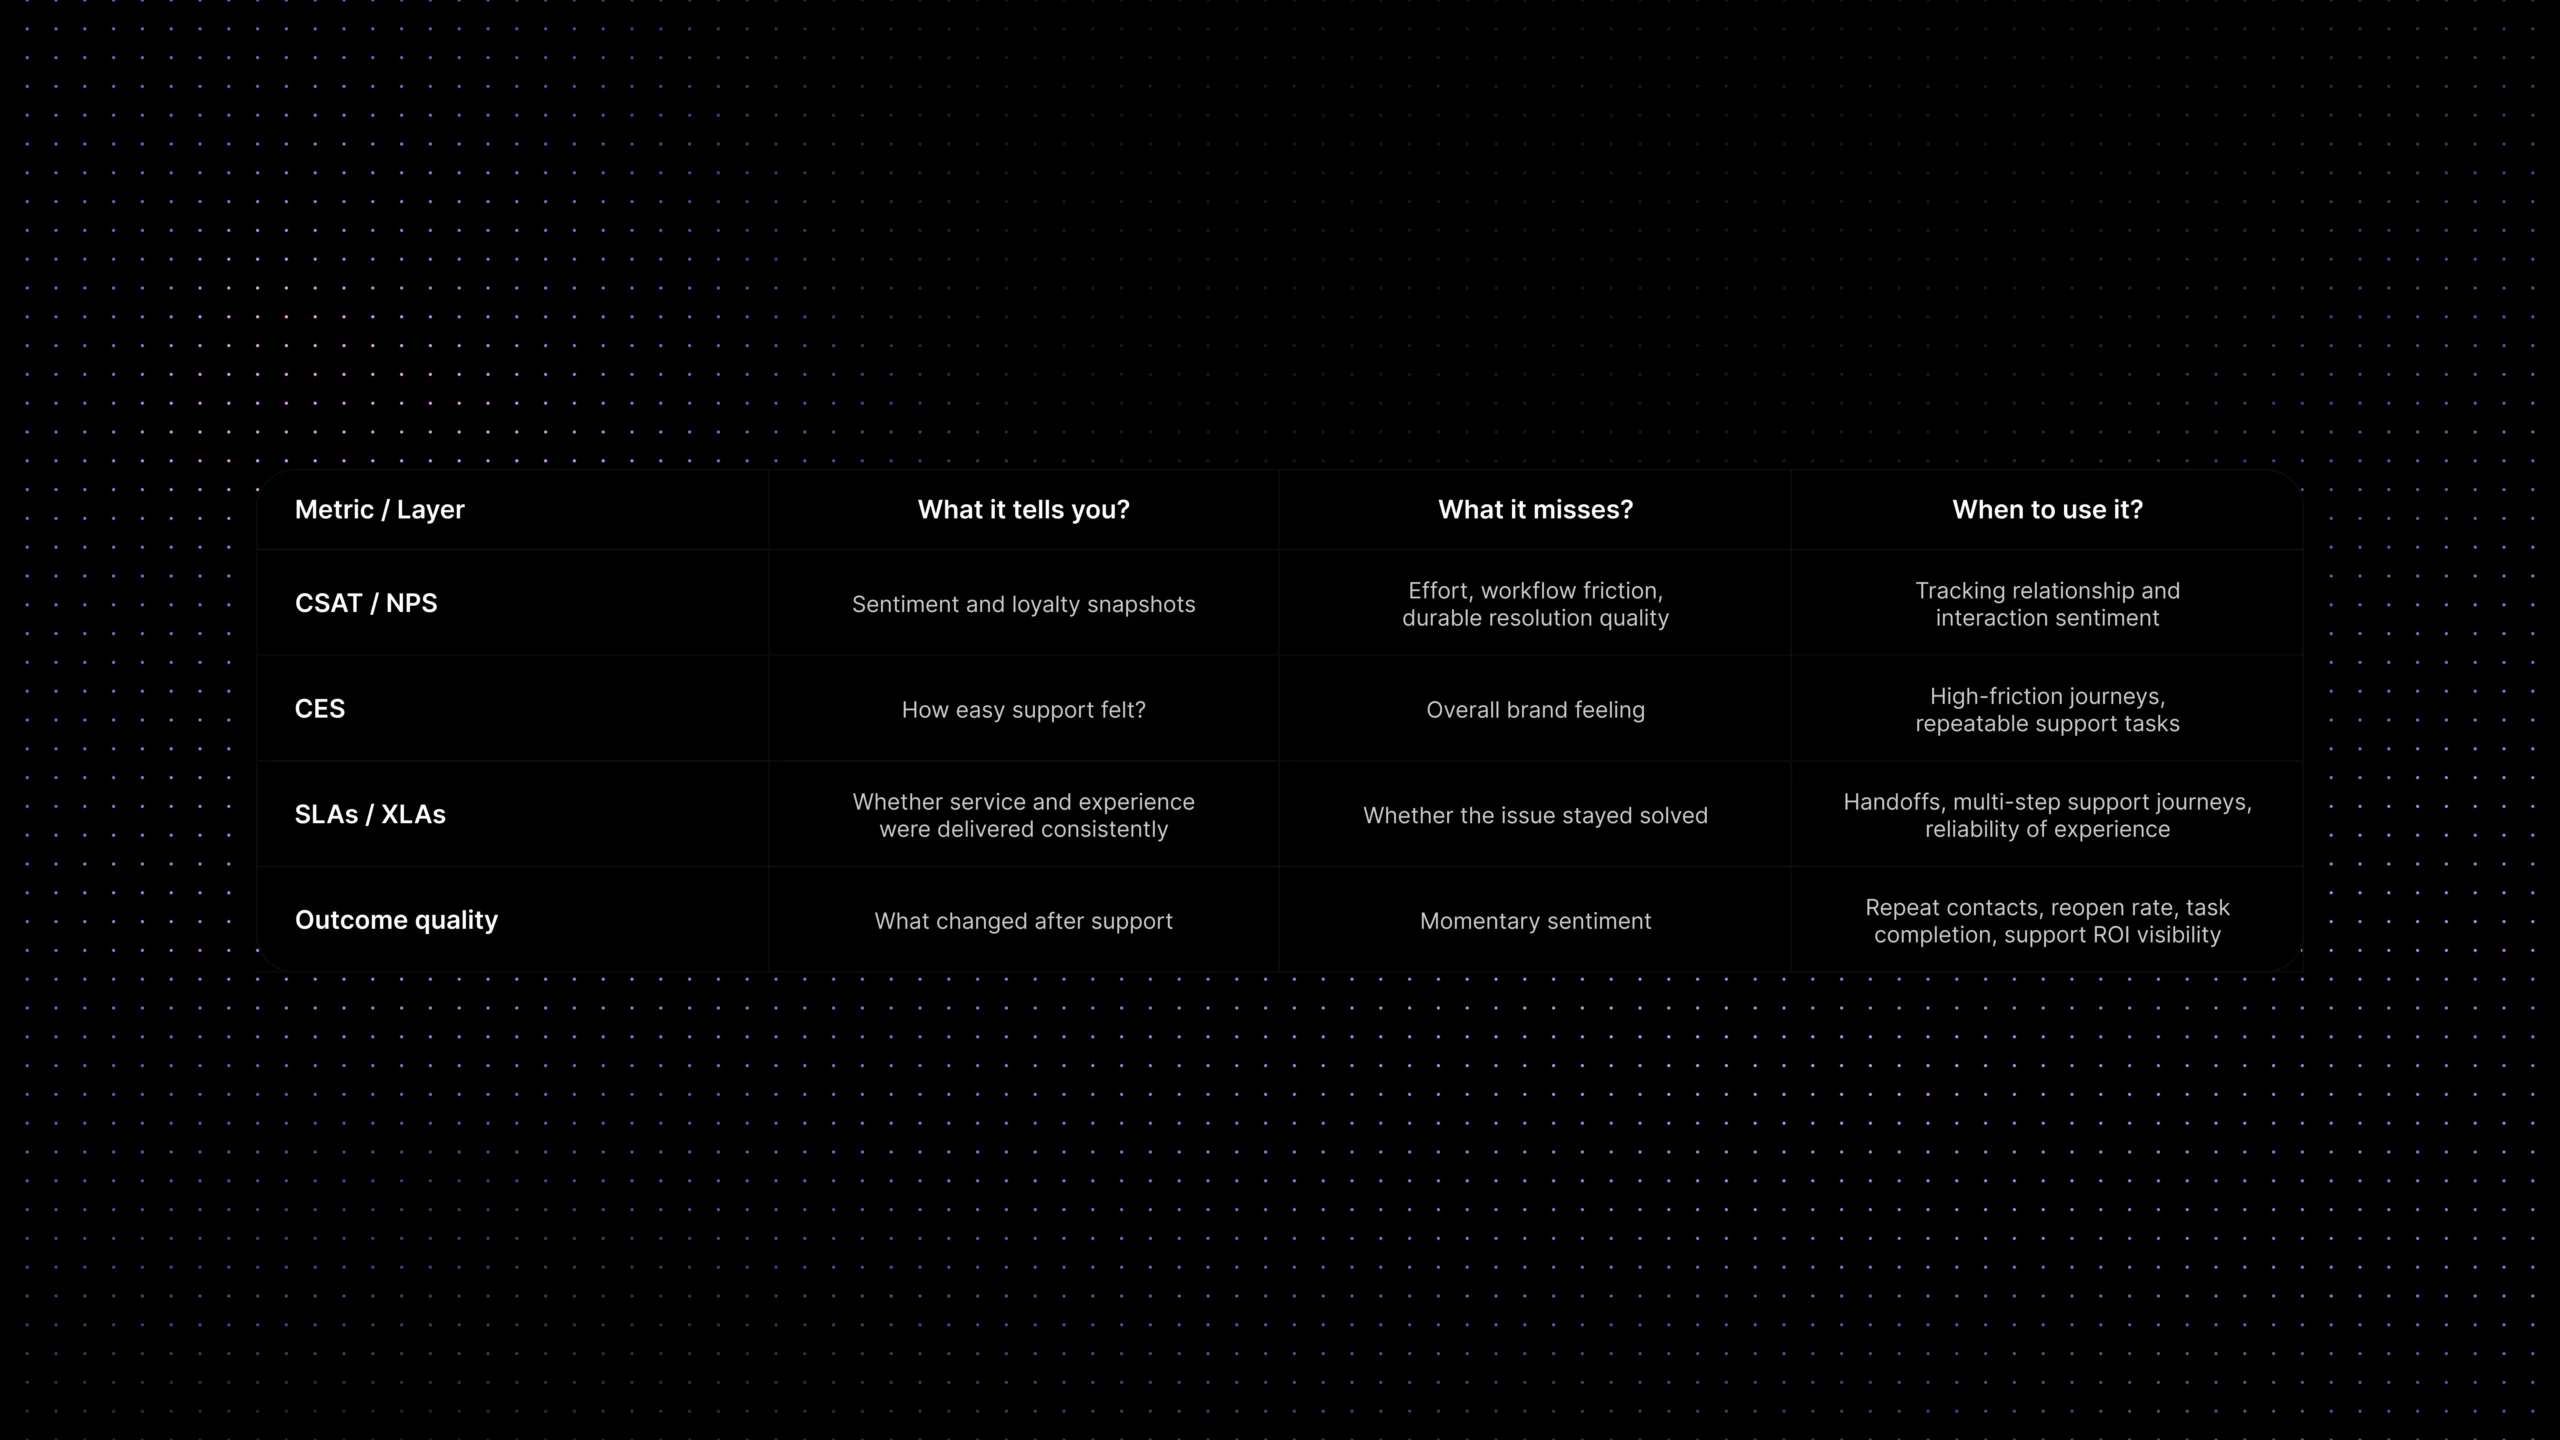
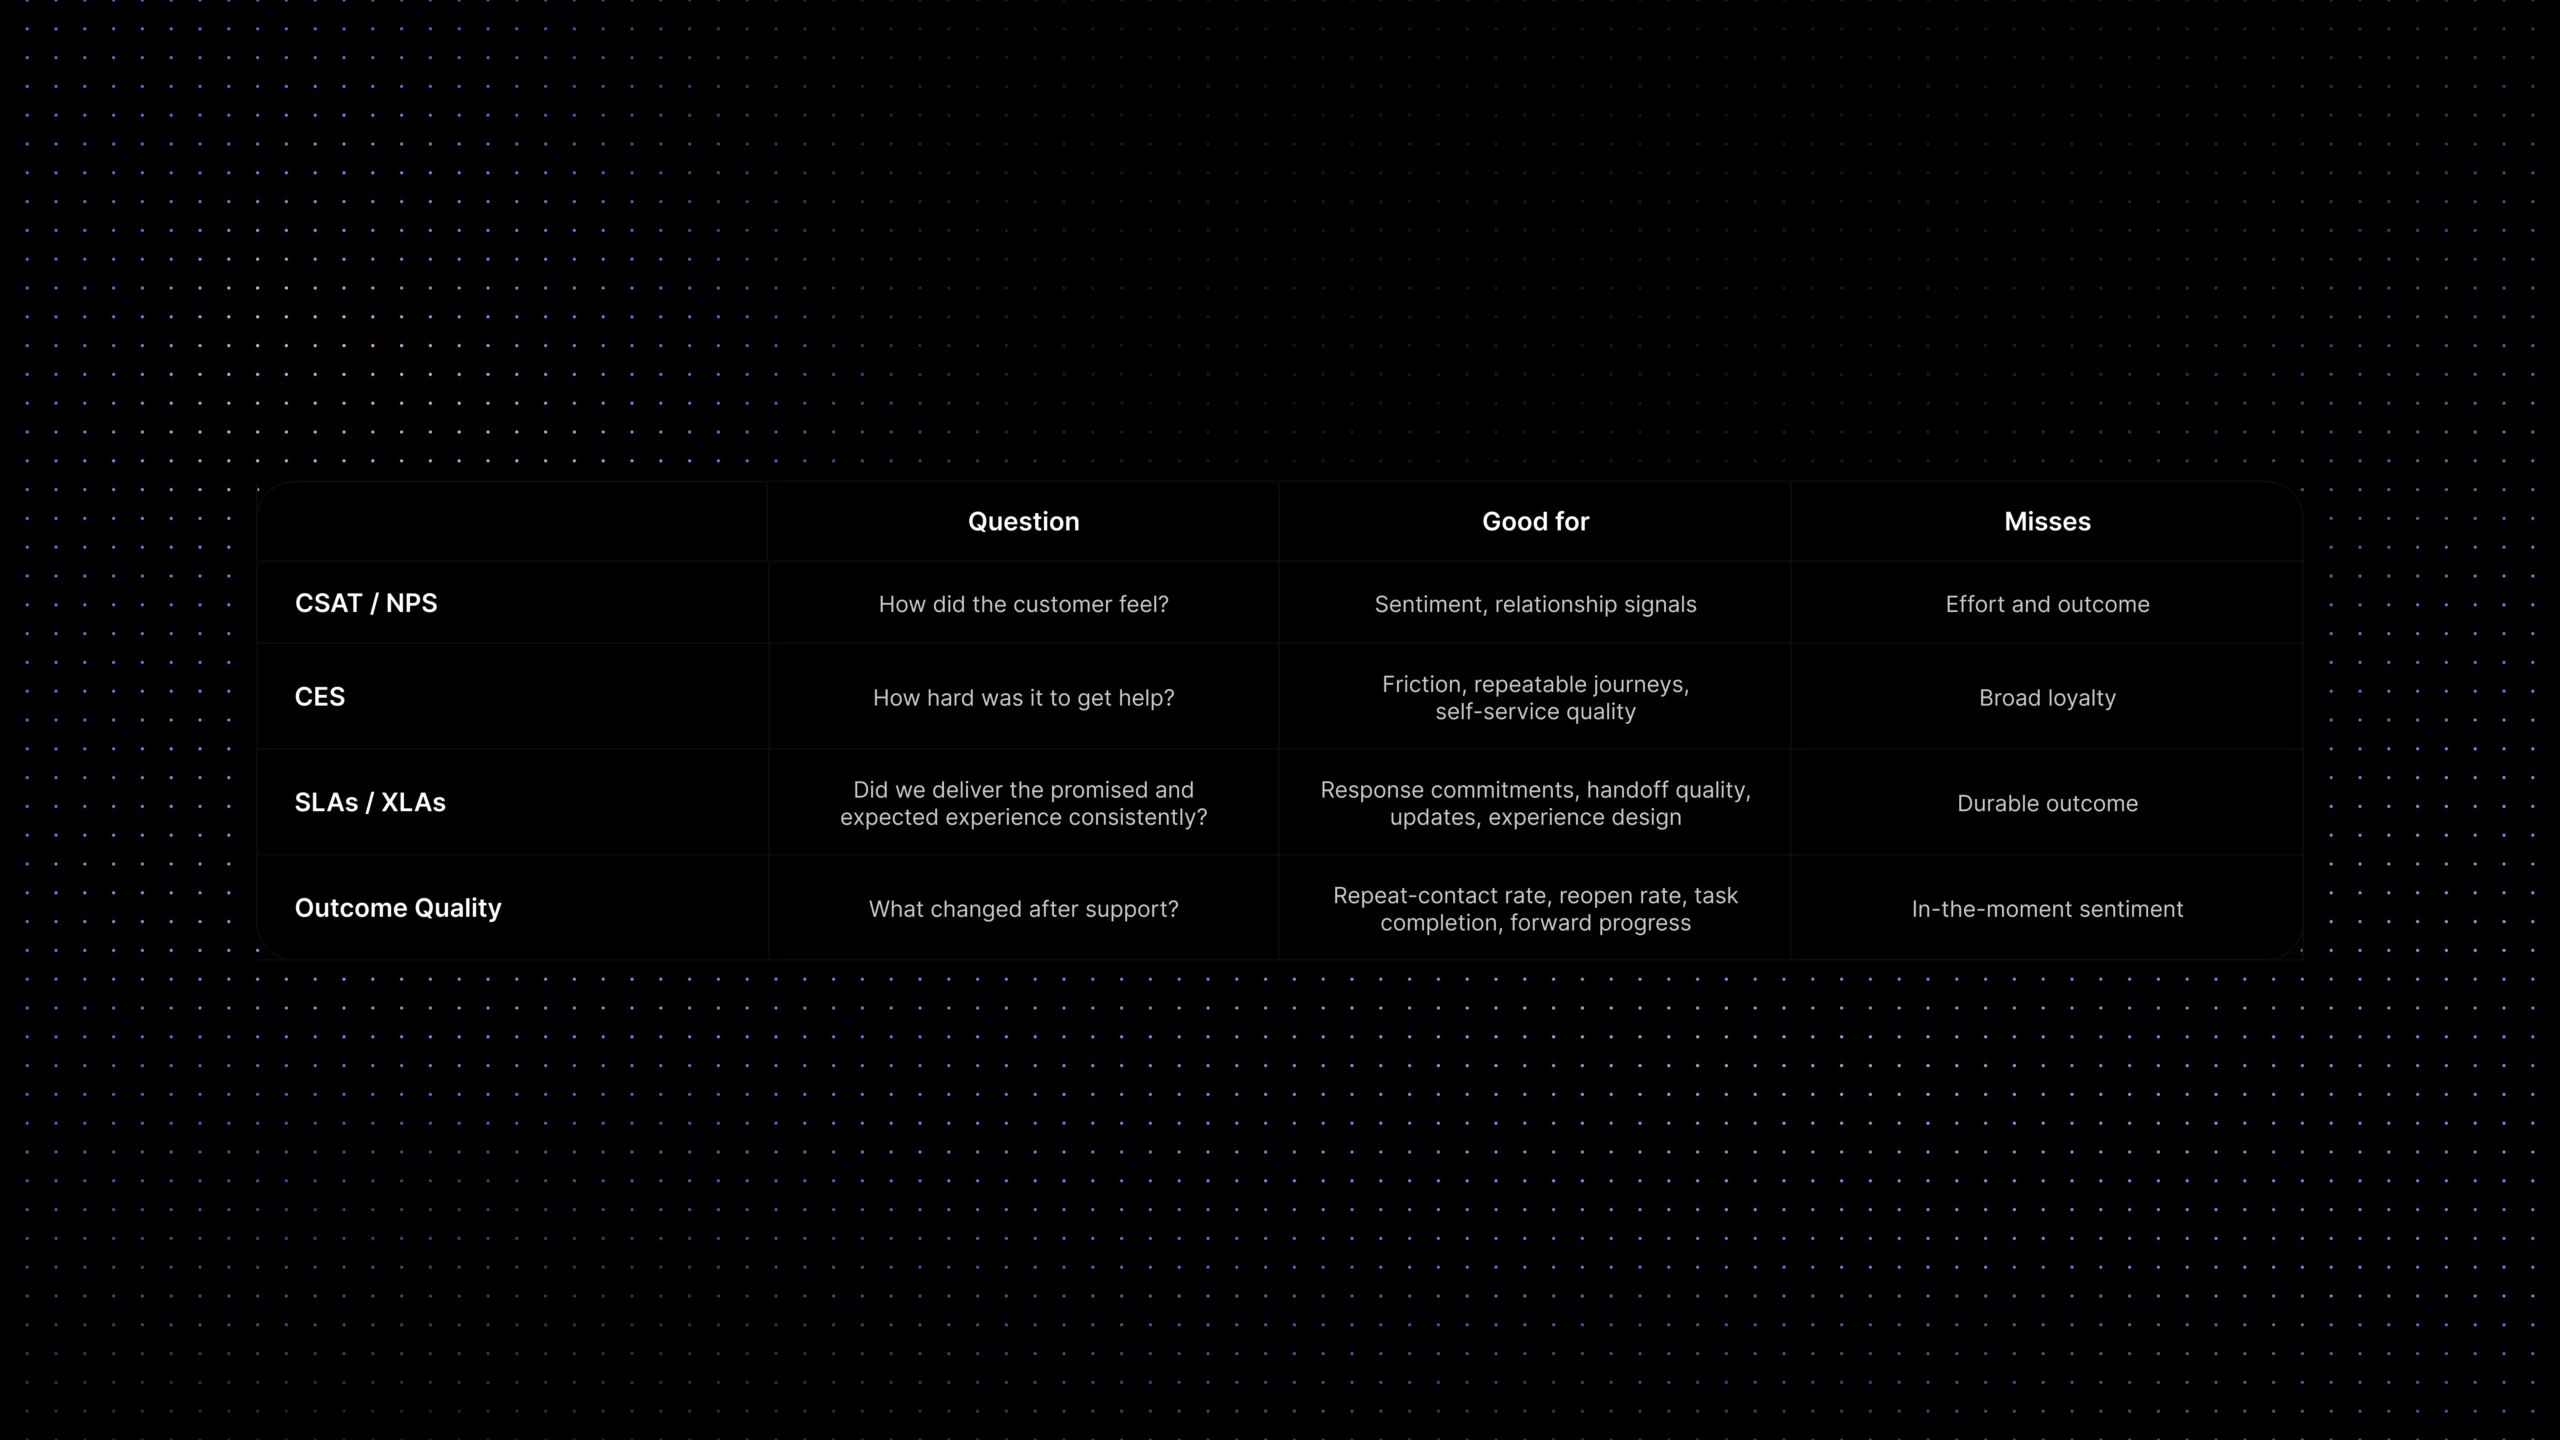
A useful support scorecard should answer four different questions. First, how did the customer feel? Second, how hard was it for them to get help? Third, did the team deliver the promised experience consistently? Fourth, did support actually change the customer’s situation for the better?
CSAT and NPS mostly live in the first question. They still matter. But strong support measurement needs more than sentiment. It also needs signals about effort, consistency, and customer outcome. That usually means combining a small set of operational metrics with a smaller set of experience metrics instead of relying on one number to do everything.
This is also why support metrics should stay close to real workflow decisions. A scorecard is only useful if it helps you fix something: routing, handoff quality, self-service gaps, escalation quality, reply speed, knowledge quality, or ownership clarity. If a metric does not change what the team does next, it becomes reporting theater.
Support metrics at a glance
| Metric family | What it answers | Best use | What it misses |
|---|---|---|---|
| CSAT / NPS | Did the customer feel satisfied or loyal? | Relationship health and sentiment snapshots | Effort, workflow friction, and actual resolution quality |
| CES | How hard was it to get help or finish the task? | High-friction journeys, repeated issue types, self-service and assisted support | Whether the customer liked the brand overall |
| SLAs / XLAs | Did the team deliver the promised experience consistently? | Response commitments, handoff quality, updates, perceived experience | Whether the issue stayed solved |
| Outcome metrics | What changed after support? | Repeat contacts, reopen rate, completion, adoption, confidence | How the customer felt in the moment |
Why CSAT and NPS are useful but incomplete
CSAT is helpful because it is simple. It tells you how customers felt about a specific interaction. NPS is useful because it gives a broader sense of loyalty and advocacy. Both have value. The problem appears when teams ask them to explain support quality on their own.
A support interaction can earn a decent CSAT score and still be expensive, high-effort, or operationally weak. A customer may be polite, grateful to finally get a fix, and still have taken three contacts, two handoffs, and one unnecessary escalation to get there. On the dashboard, that can still look acceptable if you only stare at satisfaction.
NPS has a different issue. It is even farther from the support moment. It is useful for trend context, but it is too broad to explain whether support made the customer’s life easier after a billing problem, onboarding blocker, or product workflow issue.
That is why many SaaS teams eventually add other measures. They keep CSAT and NPS, but they stop pretending those scores alone can explain effort, consistency, and outcome quality. This is also where support leaders often start connecting measurement to operational topics like first response time, customer support workflow audit, and prevent SLA breaches.
Related reading: first response time, customer support workflow audit, and prevent SLA breaches.
Customer Effort Score: what it measures and how to use it
Customer effort score, usually shortened to CES, measures how easy or hard it was for a customer to get help or finish the task they came to support for. That makes it especially useful in support, because support quality is often less about delight and more about removing friction.
A strong CES question usually stays simple. It asks whether getting help felt easy. That simplicity is what makes the metric useful. When a customer says the interaction was difficult, that answer usually points to real process problems: too many handoffs, poor self-service, repeated explanations, unclear ownership, or an issue that should have been prevented upstream.
CES works especially well for repeatable journeys. Think password reset problems, billing clarifications, plan changes, onboarding blockers, account access issues, or feature setup questions. In these cases, support does not need a vague feeling score alone. It needs to know whether the journey felt easy to complete.
The most useful way to manage CES is not to obsess over one perfect benchmark. Trend it by issue type, channel, journey, and segment. A product-bug escalation will naturally feel different from a billing address change. CES becomes much more useful when you compare like with like.
If you already publish help content, CES also pairs well with self-service measurement. Teams can use it to test whether a knowledge-base flow or AI-assisted answer actually reduced effort before the conversation reached an agent. That is one reason it fits naturally beside customer self-service for SaaS and knowledge base AI chatbot strategy. For more information you can read https this article.
Related reading: customer self-service for SaaS and knowledge base AI chatbot.
Experience Level Agreements: where XLAs fit
Experience Level Agreements, or XLAs, help teams measure whether the experience around support felt acceptable, not just whether a timer was met. That is why XLAs are best understood as a complement to SLAs rather than a replacement for them.
An SLA tells you whether the team met a service commitment such as first response or resolution time. An XLA asks a different question: did the experience feel clear, confident, and low-friction from the customer’s point of view? In support, that can include things like proactive updates during delays, quality of handoff, clarity of next steps, or whether the customer had to repeat themselves.
That distinction matters because a team can technically hit its SLA and still create a poor experience. A ticket can be answered inside the target window, but the reply may not move the customer forward. Or the customer may get passed between teams with no visible continuity. A pure SLA view will not capture that very well.
XLAs are especially useful when support spans multiple teams, frequent escalations, and a mix of self-service, AI, and human handoff, where experience quality often breaks between steps rather than within a single reply.
CSAT vs NPS vs CES vs XLAs vs outcome quality
| Metric | Best question | Good for | Weak spot | Keep? |
|---|---|---|---|---|
| CSAT | Did the customer feel satisfied? | Interaction-level sentiment | Does not show effort or durable outcome | Yes |
| NPS | How likely are they to recommend us? | Relationship trend context | Too broad for support moments | Yes |
| CES | How easy was it to get help? | Friction and journey quality | Not a loyalty metric | Yes |
| XLAs | Did the experience feel consistently good? | Handoffs, updates, experience quality | Needs clear design and governance | Sometimes |
| Outcome quality | What changed after support? | Repeat contacts, adoption, completion | Needs stronger instrumentation | Yes |
Outcome quality in support: what actually changed for the customer
If CES tells you how hard support felt, outcome quality tells you whether support changed anything meaningful. This is the layer many teams miss because it is harder to measure than survey sentiment. It usually requires combining ticket data, workflow data, and customer behavior after the interaction.
In practice, outcome quality can show up through measures such as repeat-contact rate, reopen rate, resolution confidence, task completion, self-service success, or whether the customer moved forward without needing another avoidable touch. These are not abstract metrics. They answer a real business question: did support remove friction, or did it simply close a ticket?
Outcome quality is often the bridge between support measurement and ROI discussions. It helps leaders move from ‘customers seemed satisfied’ to ‘support reduced effort, prevented repeat work, and improved the customer’s path forward.’ That creates a much stronger operating conversation than sentiment alone.
AI accuracy is part of outcome quality
For teams using AI in support, outcome quality should also include answer accuracy. A fast reply does not help if the answer is vague, ungrounded, or wrong. That means support leaders should look at whether AI-assisted answers were factually correct, whether they were grounded in approved support content, and whether they moved the customer forward without creating a second avoidable contact.
This is one reason outcome quality matters more than raw automation rates. A high automation rate with weak answer quality creates hidden friction. A lower automation rate with accurate, grounded support usually creates a better customer experience and a more trustworthy support system.
A practical support scorecard beyond CSAT/NPS
The easiest mistake here is turning measurement into a giant list. Most SaaS teams do not need twenty-five metrics. They need a small scorecard that helps them see effort, quality, consistency, and business impact without losing focus.
A practical support scorecard usually works best in five layers: sentiment, effort, service commitments, operational health, and outcome quality. That gives leaders a fuller picture without overwhelming the team.
Done well, this also makes support conversations better across the company. Product teams can see which journeys create effort. Operations teams can see where handoffs break. Leadership can see whether support is getting more efficient without quietly lowering quality.
| Layer | Metric examples | Why it matters | Start or mature? |
|---|---|---|---|
| Sentiment | CSAT, case feedback | Keeps an eye on how support felt | Start |
| Effort | CES, easy-to-resolve rating | Shows whether support reduced friction | Start |
| Commitments | First response SLA, resolution SLA | Shows whether the team met promised service levels | Start |
| Operational health | First response time, reopen rate, transfer rate | Explains why the experience looks the way it does | Mature |
| Outcome quality | Repeat-contact rate, task completion, self-service success | Shows whether support made the customer’s job easier | Mature |
Teams using AI may also want one simple quality signal for automated resolution. The important question is not only whether a conversation was deflected. It is whether the automated answer resolved the issue accurately, privately, and without creating more work later. That is a much stronger measure than deflection volume alone.
Which metrics to prioritize first
If your team is early in this journey, do not begin with XLAs and a complex dashboard. Start with the scorecard pieces that change decisions fastest. For most SaaS teams, that means keeping CSAT, adding CES for high-friction journeys, tracking one or two core response and resolution measures, and introducing one outcome-quality signal such as repeat-contact rate or reopen rate.
Once the basics are in place, you can layer in richer quality measures. XLAs make more sense when the support journey spans multiple teams or channels. Outcome-quality measures become more valuable when your ticketing, knowledge, workflow, and analytics data are connected enough to show whether support actually solved the next problem too.
A good rule is this: add metrics in the order that improves decision quality. If a number gives you a new action, keep it. If it only makes the dashboard look busier, leave it out.
Start here if you want a cleaner scorecard
- Keep CSAT, but stop using it as your only quality signal.
- Add CES for one high-volume support journey first.
- Track first response time and first response SLA separately from satisfaction.
- Use repeat-contact rate or reopen rate as your first outcome-quality measure.
- Review handoff quality where multiple teams touch the same issue.
- Only introduce XLAs when you can clearly define the experience you want to protect.
Common measurement mistakes
The first mistake is collecting too many metrics too early. That usually creates reporting noise, not insight. Teams end up with a dashboard they rarely use because every number seems equally important.
The second mistake is separating metrics from workflow. If CES drops for billing tickets, that should trigger a review of the workflow, macros, policy wording, or self-service content around billing. A metric that never changes the operating system becomes decoration.
The third mistake is mixing unlike cases. Support effort for a technical outage, an onboarding setup question, and a simple password reset should not all be interpreted the same way. Segment by issue type, channel, or journey where the difference matters.
The fourth mistake is forgetting that metrics do not solve support quality on their own. A stronger scorecard helps teams see problems earlier, but it still depends on better routing, better knowledge, better ownership, and cleaner workflows to improve the underlying experience.
Where Inquirly fits
A better support scorecard works best when the underlying support system is connected. If conversations live in one tool, tickets in another, workflows somewhere else, and knowledge usage is invisible, the metrics will stay fragmented too.
Inquirly helps SaaS teams bring conversations, ticketing, routing, workflows, and knowledge into one workspace. That makes it easier to measure more than sentiment. Teams can look at effort, first response, handoffs, self-service effectiveness, and outcome signals in the context of the same support operation instead of stitching together half-connected reports.
That is especially useful when support leaders want to move from ‘what did customers say?’ to ‘what actually improved, where is effort still high, and which workflow should we fix next?’
Conclusion
Support leaders rarely need more metrics. They need better ones. CSAT and NPS still belong in the picture, but they stop being enough once the team needs to understand effort, consistency, and outcome quality with more precision.
A stronger scorecard does not have to be complicated. Start with the measures that explain what customers felt, how hard support was, whether the promised experience was delivered, and whether the customer’s situation actually improved. That is usually enough to move support measurement from passive reporting to better operating decisions.
Soft CTA: See how Inquirly helps teams connect conversations, tickets, workflows, knowledge, and analytics in one workspace so support metrics become easier to trust and easier to act on.